在业务开发中,我们可能经常会碰到这样的需求:先按某个字段分组,然后在分组结果中再按其他字段排序,最后在每组中分别取出排序后的某条记录甚至某几条记录。
这篇博文是想写在OpenTSDB中怎么做到的,不过,先偏个题,我们来看看在MySQL中应该怎样实现?请参考Stackoverflow上的这个答案。其实不难,一条SQL语句就可以做到。
下面回归正题。
先放上官方文档中对first/last aggregator的描述:
These aggregators will return the first or the last data point in the downsampling interval. E.g. if a downsample bucket consists of the series 2, 6, 1, 7 then the first aggregator will return 1 and last will return 7. Note that this aggregator is only useful for downsamplers.
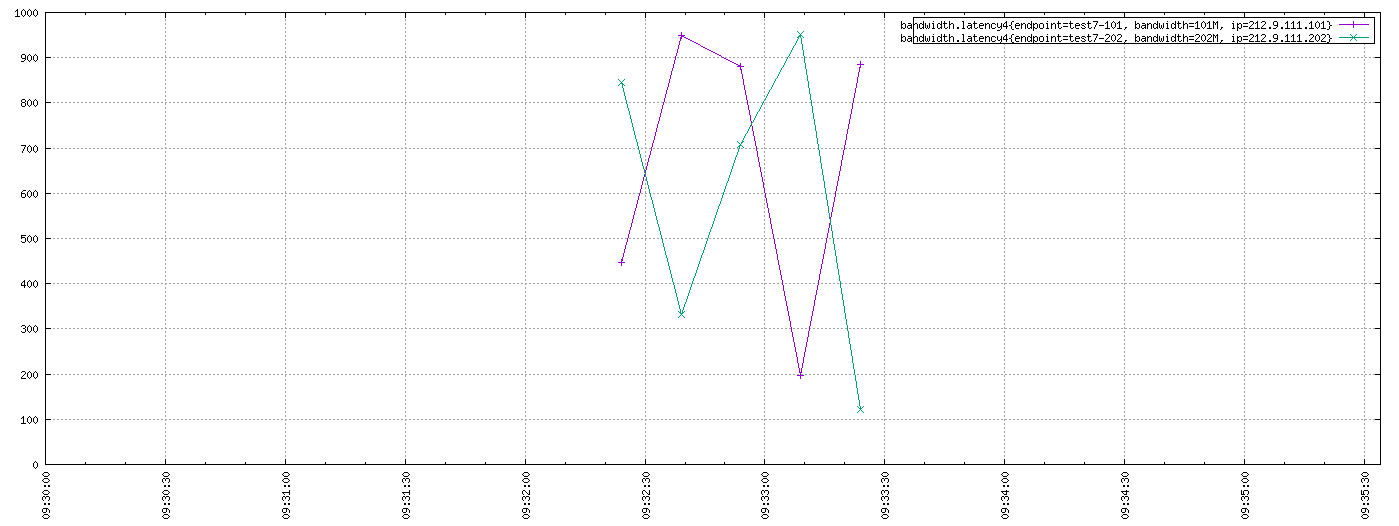
我们先来个基础的查询,即找出某个指标(Metric)在指定时间段内的所有数据。
POST http://localhost:4242/api/query
{
    "start": "2017/07/05-09:30:00",
    "end": "2017/07/05-10:00:00",
    "queries": [
        {
            "metric": "bandwidth.latency4",
            "aggregator": "none"
        }
    ]
}
这里我们使用了none这个aggregator,它的意思是
Skips group by aggregation. This aggregator is useful for fetching the raw data from storage as it will return a result set for every time series matching the filters. Note that the query will throw an exception if used with a downsampler.
即我们不需要对数据进行group。更多的aggregator请参考这里,有一些不好理解,需要仔细研读下文档。
Response:
[
    {
        "metric": "bandwidth.latency4",
        "tags": {
            "endpoint": "test7-101",
            "ip": "212.9.111.101",
            "bandwidth": "101M"
        },
        "aggregateTags": [],
        "dps": {
            "1499218344": 448,
            "1499218359": 950,
            "1499218374": 880,
            "1499218389": 198,
            "1499218404": 884
        }
    },
    {
        "metric": "bandwidth.latency4",
        "tags": {
            "endpoint": "test7-202",
            "ip": "212.9.111.202",
            "bandwidth": "202M"
        },
        "aggregateTags": [],
        "dps": {
            "1499218344": 845,
            "1499218359": 332,
            "1499218374": 707,
            "1499218389": 951,
            "1499218404": 121
        }
    }
]
在Web Query UI上做同样的查询,有图看起来更轻松些:
我们先使用Downsample的方式来获取the last data point,在请求体中添加一个"downsample": "0all-last"参数即可。
{
    "start": "2017/07/05-09:30:00",
    "end": "2017/07/05-10:00:00",
    "queries": [
        {
            "metric": "bandwidth.latency4",
            "aggregator": "none",
            "downsample": "0all-last"
        }
    ]
}
Response:
[
    {
        "metric": "bandwidth.latency4",
        "tags": {
            "endpoint": "test7-101",
            "ip": "212.9.111.101",
            "bandwidth": "101M"
        },
        "aggregateTags": [],
        "dps": {
            "1499218200": 884
        }
    },
    {
        "metric": "bandwidth.latency4",
        "tags": {
            "endpoint": "test7-202",
            "ip": "212.9.111.202",
            "bandwidth": "202M"
        },
        "aggregateTags": [],
        "dps": {
            "1499218200": 121
        }
    }
]
The last data point取出来了,但是timestamp却并不是我们所期望的,那它的值是怎么取的呢?在Downsampling的文档里有描述。
When using the
0all-interval, the timestamp of the result will be the start time of the query.
那什么是start time of the query呢?其实就是你在request body中指定的这个"start": "2017/07/05-09:30:00"参数。
那再去Web Query UI上做Downsample查询会是什么样的呢?勾选上Downsample并将其下的选项设置为last-10m-none,得到下图:
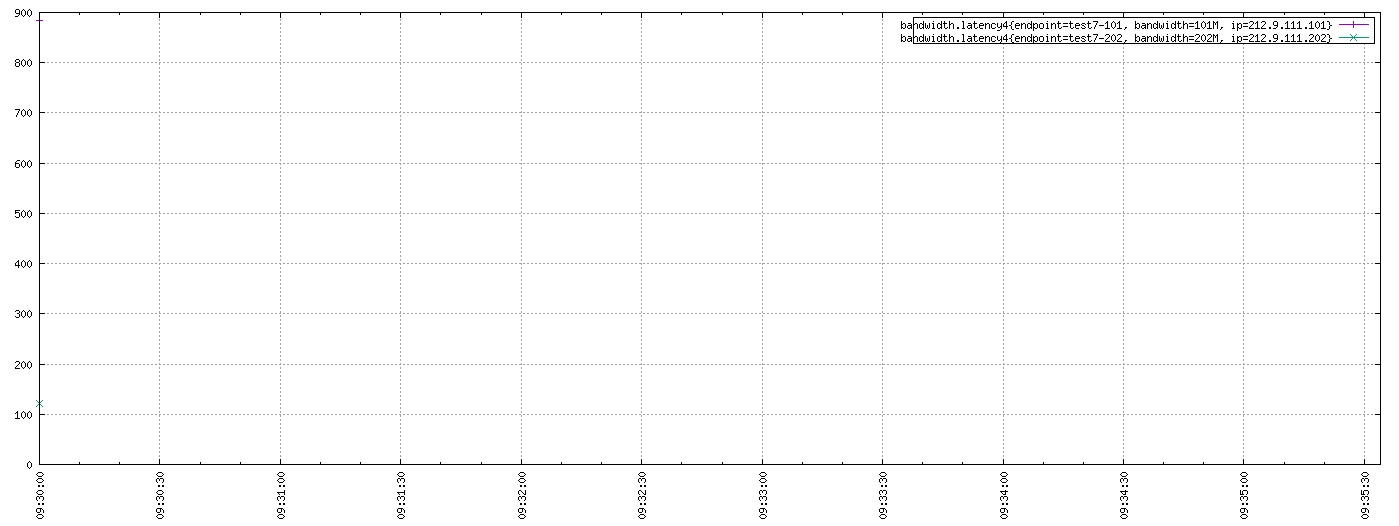
看这张图眼神儿一定要好,不然很难发现那两个data point在哪里。如果你还没发现的话,请仔细观察Y轴。可惜的是这两个data point在图上的timestamp也是2017/07/05-09:30:00。
那我们再次验证下,在Web Query UI上将From改成2017/07/05-09:20:00,Downsample设置成20m-last-none。
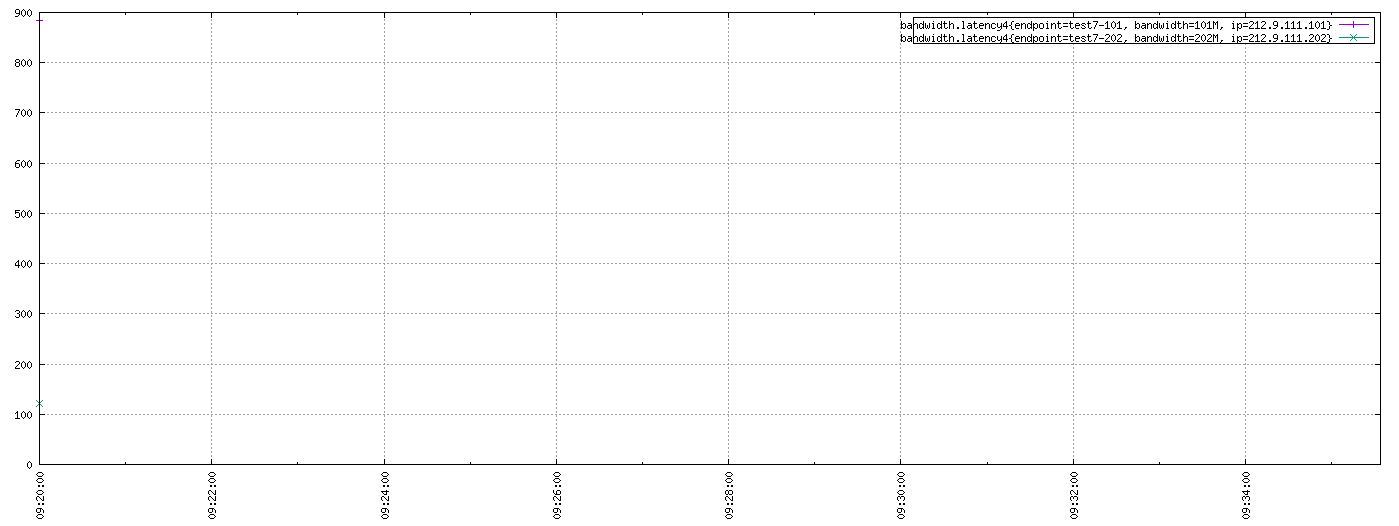
结果还是一样的。虽然返回了the last data point,但是唯独遗失了data point中timestamp的值,而在某些情况下,这个值又是有意义的。
上面是尝试用Downsample的方式去实现我们的目标,而根正苗红的方式应该是用HTTP API中的/api/query/last。
我当前使用的OpenTSDB版本是2.3.0,为了调出api-query-last的期望结果花费了蛮多的时间来搜索、Debug源码和测试。以下描述的是我自己调试的结果。
首先添加以下配置到opentsdb.conf文件里
tsd.core.meta.enable_tsuid_tracking = true
注意此时conf里仍然不包含tsd.core.meta.enable_realtime_ts和tsd.core.meta.enable_tsuid_incrementing的配置,所以它们俩的默认值都是false。
这是Metadata相关的内容,请自行阅读文档并深入理解。说实话,我自己理解的也不透彻,唯有动手多做些例子来测试下了。和Metadata相关的知识还有UIDs and TSUIDs。我们从这些里面应该可以窥见一些OpenTSDB的设计哲学。
既然改了配置,那就重新造些测试数据吧~
POST http://localhost:4242/api/query
{
    "start": "2017/07/05-15:50:00",
    "end": "2017/07/05-17:00:00",
    "queries": [
        {
            "metric": "bandwidth.latency5",
            "aggregator": "none"
        }
    ]
}
Response:
[
    {
        "metric": "bandwidth.latency5",
        "tags": {
            "endpoint": "test8-303",
            "ip": "212.9.111.303",
            "bandwidth": "303M"
        },
        "aggregateTags": [],
        "dps": {
            "1499241290": 837,
            "1499241305": 443,
            "1499241320": 909,
            "1499241335": 496,
            "1499241350": 377
        }
    },
    {
        "metric": "bandwidth.latency5",
        "tags": {
            "endpoint": "test8-404",
            "ip": "212.9.111.404",
            "bandwidth": "404M"
        },
        "aggregateTags": [],
        "dps": {
            "1499241290": 378,
            "1499241305": 914,
            "1499241320": 511,
            "1499241335": 709,
            "1499241350": 992
        }
    }
]
用api-query-last取出来看看,在不设置backScan参数的情况下
POST http://localhost:4242/api/query/last
{
    "queries": [
        {
            "metric": "bandwidth.latency5",
            "tags": {
            	"endpoint": "test8-303"
            }
        }
    ],
    "resolveNames":true
}
Response:
[
    {
        "metric": "bandwidth.latency5",
        "timestamp": 1499241350000,
        "value": "377.0",
        "tags": {
            "endpoint": "test8-303",
            "bandwidth": "303M",
            "ip": "212.9.111.303"
        },
        "tsuid": "000011000003000081000005000082000010000083"
    }
]
我们得到了期望的the last data point且它的timestamp也和我们push的时间点相吻合。
那在Request body中去掉tags参数再试试呢?
POST http://localhost:4242/api/query/last
{
    "queries": [
        {
            "metric": "bandwidth.latency5"
        }
    ],
    "resolveNames":true
}
Response:
[
    {
        "metric": "bandwidth.latency5",
        "timestamp": 1499241350000,
        "value": "377.0",
        "tags": {
            "endpoint": "test8-303",
            "bandwidth": "303M",
            "ip": "212.9.111.303"
        },
        "tsuid": "000011000003000081000005000082000010000083"
    },
    {
        "metric": "bandwidth.latency5",
        "timestamp": 1499241350000,
        "value": "992.0",
        "tags": {
            "endpoint": "test8-404",
            "bandwidth": "404M",
            "ip": "212.9.111.404"
        },
        "tsuid": "000011000003000084000005000085000010000086"
    }
]
也是正确的。
遗憾的是,到现在仍然不能通过以下方式
POST http://localhost:4242/api/query/last
{
    "queries": [
        {
            "metric": "bandwidth.latency5",
            "tags": {
            	"endpoint": "test8-303"
            }
        }
    ],
    "resolveNames":true,
    "backScan":24
}
调试出来期望的结果。
暂时没有对tsd.core.meta.enable_tsuid_incrementing = true做测试,根据enabling-metadata文档里的描述,它对系统性能所造成的影响要比tsd.core.meta.enable_tsuid_tracking = true更大。我觉得文档在这一块的描述并不是特别详细,看了好多遍也理解不清楚两个参数设置后对tsdb-meta表有什么确切的影响,比如到底会增加几条记录等等。
后续再努力吧~