在使用Falcon Plus的过程中有时会遇到一些问题但是查询文档又未果,特别是碰到API调用时明明传入了正确的参数却总也得不到期望结果的时候。
在这种情况下,自己亲自去Debug源码也是一个不错的选择,除了可以一窥框架内部的处理逻辑,也许还能发现一些Bug呢~ 当然前提是 —— 不要畏惧Go。
我们有选择地仅Debug当前关心的module,其它module还是正常启动;甚至也可以先启动好所需要的全部modules(built出来的噢),然后stop掉我们想debug的那个,最后去源代码目录下以Debug模式启动stopped的module.
步骤如下:
- 打开module下的main.go文件,它是程序启动的入口。我们观察到有这么两行
 func main() {
     cfgTmp := flag.String("c", "cfg.json", "configuration file")
是的,module启动前要读取属于它自己的配置文件。虽然在main.go的同级目录下有一个
cfg.example.json文件,但是我们并不用它。 我们要从built出来的相应module/config目录下拷贝一份cfg.json到和main.go同级的目录。 - 在IDEA中点击
Edit Configurations...,打开Run/Debug Configurations窗口。 - 点左上角的+号新建一个
Go Application,指定好要运行的main.go。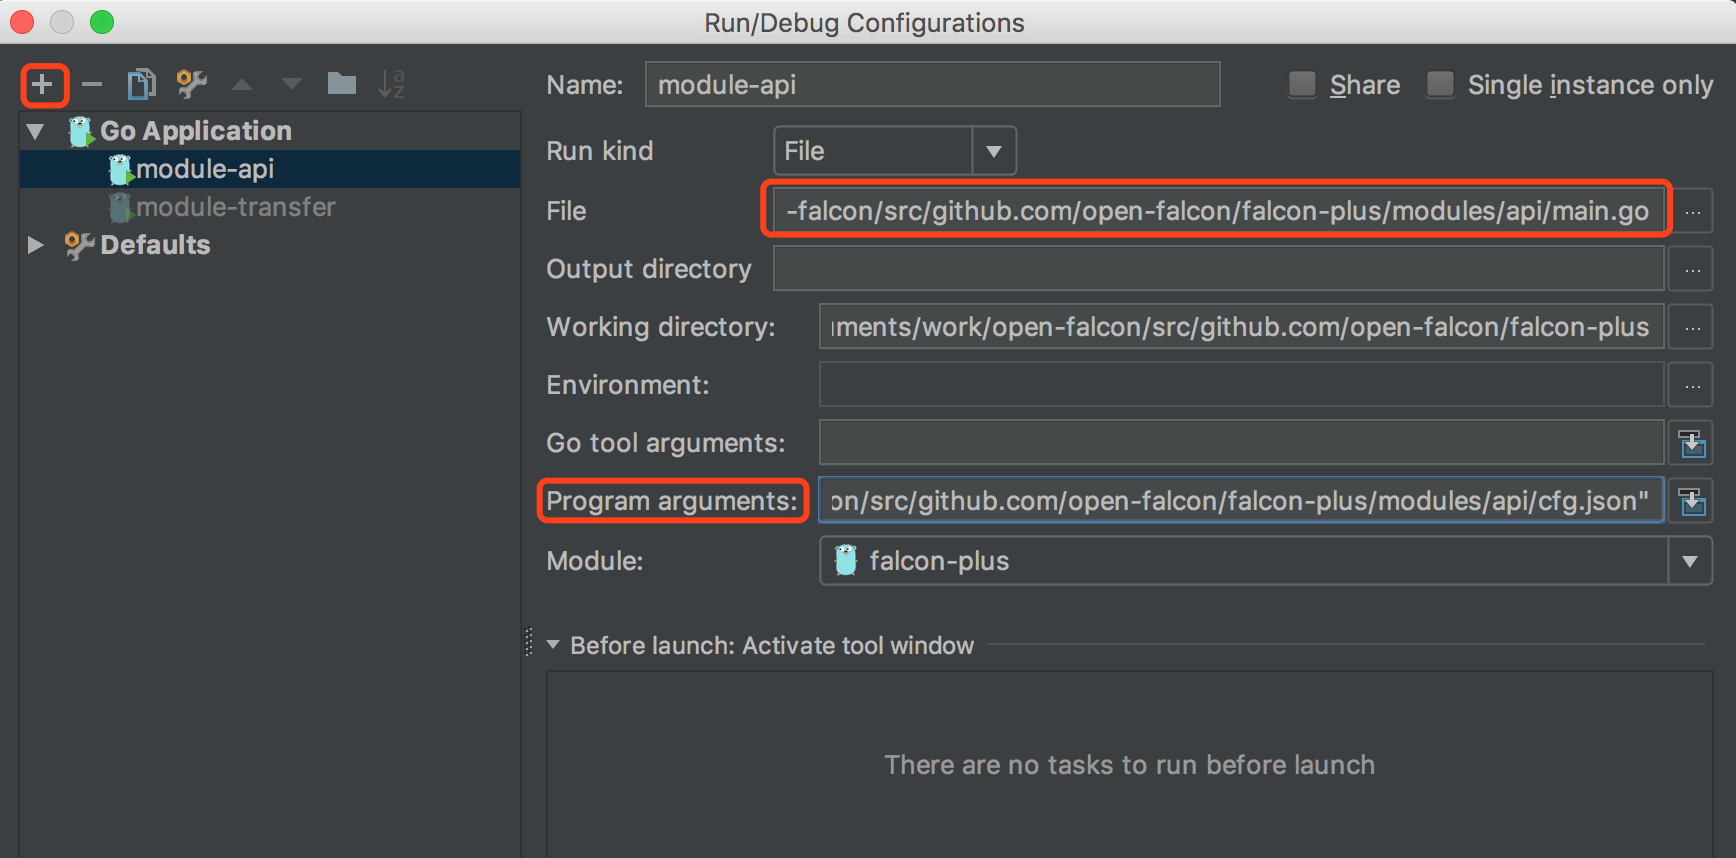
- 此外,还要在
Program arguments里指定好我们刚刚拷贝过来的cfg.json的绝对路径。 - 保存设置后点击Debug图标开始运行吧。
不过,我这边的测试结果是,在Debug前要先打好断点,module运行后再打断点是无效的,奇怪~
我这次Debug的是api module,大致的输出如下。
"/Users/echo/Library/Application Support/IntelliJIdea2017.1/Go/lib/dlv/mac/dlv" --listen=localhost:49165 --headless=true exec /private/var/folders/0x/26glqvcs2yv7qtr2gxwqmf3h0000gn/T/module-apigo -- -c=/Users/echo/Documents/work/open-falcon/src/github.com/open-falcon/falcon-plus/modules/api/cfg.json
GOROOT=/usr/local/go
GOPATH=/Users/echo/Documents/work/open-falcon
/usr/local/go/bin/go build -o /private/var/folders/0x/26glqvcs2yv7qtr2gxwqmf3h0000gn/T/module-apigo -gcflags "-N -l" /Users/echo/Documents/work/open-falcon/src/github.com/open-falcon/falcon-plus/modules/api/main.go
API server listening at: 127.0.0.1:49165
2017/06/27 17:17:01 debug.go:45: [GIN-debug] [WARNING] Running in "debug" mode. Switch to "release" mode in production.
 - using env:	export GIN_MODE=release
 - using code:	gin.SetMode(gin.ReleaseMode)

time="2017-06-27T17:17:01+08:00" level=info msg="graph.Start ok"
time="2017-06-27T17:17:01+08:00" level=debug msg="will start with port:127.0.0.1:8080"
2017/06/27 17:17:01 debug.go:45: [GIN-debug] GET    /                         --> github.com/open-falcon/falcon-plus/modules/api/app/controller.StartGin.func1 (4 handlers)
2017/06/27 17:17:01 debug.go:45: [GIN-debug] GET    /api/v1/graph/endpoint    --> github.com/open-falcon/falcon-plus/modules/api/app/controller/graph.EndpointRegexpQuery (5 handlers)
2017/06/27 17:17:01 debug.go:45: [GIN-debug] GET    /api/v1/graph/endpoint_counter --> github.com/open-falcon/falcon-plus/modules/api/app/controller/graph.EndpointCounterRegexpQuery (5 handlers)
......
......
2017/06/27 17:17:01 debug.go:45: [GIN-debug] POST   /api/v1/alarm/eventcases  --> github.com/open-falcon/falcon-plus/modules/api/app/controller/alarm.AlarmLists (5 handlers)
2017/06/27 17:17:01 debug.go:45: [GIN-debug] GET    /api/v1/alarm/eventcases  --> github.com/open-falcon/falcon-plus/modules/api/app/controller/alarm.AlarmLists (5 handlers)
2017/06/27 17:17:01 debug.go:45: [GIN-debug] POST   /api/v1/alarm/events      --> github.com/open-falcon/falcon-plus/modules/api/app/controller/alarm.EventsGet (5 handlers)
2017/06/27 17:17:01 debug.go:45: [GIN-debug] GET    /api/v1/alarm/events      --> github.com/open-falcon/falcon-plus/modules/api/app/controller/alarm.EventsGet (5 handlers)
2017/06/27 17:17:01 debug.go:45: [GIN-debug] POST   /api/v1/alarm/event_note  --> github.com/open-falcon/falcon-plus/modules/api/app/controller/alarm.AddNotesToAlarm (5 handlers)
2017/06/27 17:17:01 debug.go:45: [GIN-debug] GET    /api/v1/alarm/event_note  --> github.com/open-falcon/falcon-plus/modules/api/app/controller/alarm.GetNotesOfAlarm (5 handlers)
2017/06/27 17:17:01 debug.go:45: [GIN-debug] Listening and serving HTTP on 127.0.0.1:8080
因为是api module,所以输出里会有很多Request Mapping,根据request uri找对应的controller还是很方便的。
我在调试两个API:alarm_eventcases_list和alarm_eventcases_get_by_id
第一个alarm_eventcases_list是在postman中以request body发送以下内容
{
    "endTime": 1498548900,
    "startTime": 1498546800
}
结果却总是返回
{
    "error": "startTime, endTime OR event_id, You have to at least pick one on the request."
}
一气之下就去看源码了。
在源码中发现这个api除了支持json格式的请求数据外,应该也支持form提交形式的。有代码,有真相。
type APIGetAlarmListsInputs struct {
	StartTime     int64  `json:"startTime" form:"startTime"`
	EndTime       int64  `json:"endTime" form:"endTime"`
	Priority      int    `json:"priority" form:"priority"`
	Status        string `json:"status" form:"status"`
	ProcessStatus string `json:"process_status" form:"process_status"`
	Metrics       string `json:"metrics" form:"metrics"`
	//id
	EventId string `json:"event_id" form:"event_id"`
	//number of reacord's limit on each page
	Limit int `json:"limit" form:"limit"`
	//pagging
	Page int `json:"page" form:"page"`
}
呵呵~ 果然成功了~ 尽管在快写完本篇博客时我才发现原来json形式不行是因为自己忘了在postman中勾选上Content-Type: application/json造成的。

第1个没问题了,我又去请求alarm_eventcases_get_by_id。这个api的请求参数定义如下:
type APIEventsGetInputs struct {
    StartTime int64 `json:"startTime" form:"startTime"`
    EndTime   int64 `json:"endTime" form:"endTime"`
    Status    int   `json:"status" form:"status" binding:"gte=-1,lte=1"`
    //event_caseId
    EventId string `json:"event_id" form:"event_id" binding:"required"`
    //number of reacord's limit on each page
    Limit int `json:"limit" form:"limit"`
    //pagging
    Page int `json:"page" form:"page"`
}
按照惯例,除了startTime、endTime和event_id外,我还指定了page为1,limit为20。我知道自己指定的event_id下有3条events,那就快快献身吧!哦不,是现身~
万事向来不随人愿呀~ 感慨脸…
无论怎么刷都是2条events!二气之下继续看源码。
func EventsGet(c *gin.Context) {
    var inputs APIEventsGetInputs
    inputs.Status = -1
    if err := c.Bind(&inputs); err != nil {
        h.JSONR(c, badstatus, err)
        return
    }
    filterCollector := inputs.collectFilters()
    //for get correct table name
    f := alm.Events{}
    evens := []alm.Events{}
    if inputs.Limit == 0 || inputs.Limit >= 50 {
        inputs.Limit = 50
    }
    perparedSql := fmt.Sprintf("select id, event_caseId, cond, status, timestamp from %s %s order by timestamp DESC limit %d,%d", f.TableName(), filterCollector, inputs.Page, inputs.Limit)
    db.Alarm.Raw(perparedSql).Scan(&evens)
    h.JSONR(c, evens)
}
可以Debug这个perparedSql,不过控制台直接有输出。我还很认真地拷贝这条sql到Sequel Pro中执行了,确实是返回了两条记录。可问题在哪呢?你一眼看出来了吗?是的,在limit那里。
limit with two arguments, the first argument specifies the offset of the first row to return, and the second specifies the maximum number of rows to return. The offset of the initial row is 0 (not 1):
可offset被怎么赋值的呢?直接inputs.Page。

在我的意识里,page是指定第几页,limit是指定每页多少条,offset是从它们俩里计算出来的。在Github上看了下最新的代码,还是原样处理的。
在源码里还注意到
if inputs.Limit == 0 || inputs.Limit >= 50 {
    inputs.Limit = 50
}